Setting Up Camera Feeds for Real-time Analysis
Learn how to configure cameras and enable live feed analysis in Vidsy.ai.
Overview
This tutorial will guide you through setting up your first camera feed and enabling real-time analysis. By the end, you'll have a live camera feed with AI-powered analysis running on your system.
What you’ll learn
- How to add and configure camera feeds
- Camera settings optimization
- Enabling real-time analysis
- Understanding analysis results and visual indicators
Prerequisites
- Vidsy.ai installed and running
- either:
- At least one camera connected to your system (webcam, USB camera, etc.)
- An open window of the camera feed on the same desktop
- Completed the initial setup process
Step 1: Navigate to Camera Interface
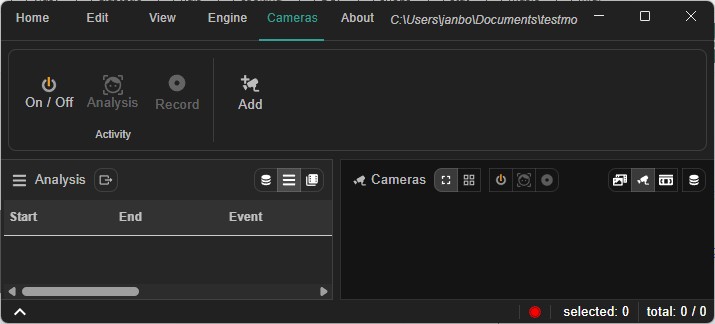
- Open Vidsy.ai and wait for the main interface to load
- Click the "Cameras" tab in the top menu bar
- You'll see the camera menu bar with options for Activity and adding a camera

Step 2: Add Your First Camera
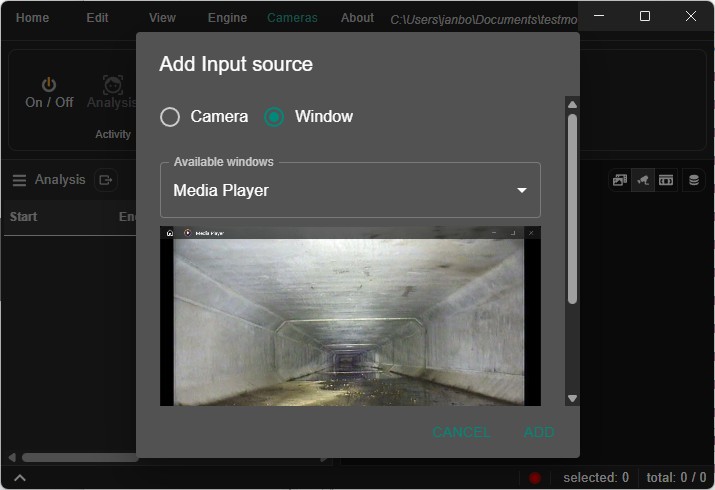
- Click the "Add" button in the cameras menu bar
- This opens the "Add Input source" dialog
Maximum of 2 input sources are supported.
-
Select input type
- Choose "Camera" for physical cameras (webcams, USB cameras)
- Choose "Window" for screen capture: this is useful when your camera is already in use by another application or when the camera type is not yet supported.
-
Select the input
- For cameras:
- From the "Available cameras" dropdown, select your camera
- You'll see a live preview of the camera feed in the dialog
- For window capture: similar procedure, select the window from the dropdown.
- For cameras:

Step 3: Configure Camera Settings
For optimal analysis performance, configure these settings:
Camera Name
- Assign a descriptive name so you can easily recognize the feed later
- Names appear in the camera grid and when creating recording bundles
Aspect Ratio
- Choose 16:9 for modern widescreen cameras
- Choose 4:3 for older or square format cameras
Resolution
- Select from available resolutions in the dropdown
- Recommended: 1280x720 or 1920x1080 for best balance of quality and performance
All video input is scaled down to the size the model expects. Different models have different input sizes, which are typically smaller than the recording resolution, so higher video resolutions usually won’t change analysis quality significantly.
Frame Rate
- Use the slider to adjust frame rate
- Recommended: 25 frames per second
- Higher capture rates provide smoother analysis but increase CPU/GPU usage
Preview Your Settings
- The live preview window shows exactly what will be captured
- All settings are applied immediately to the preview
Step 4: Add the Camera
- Click "Add" to create the camera feed
- Wait for "Adding camera..." process to complete
- Your camera will appear in the main grid using the name you provided
Your settings are saved, so the next time you open the application the same inputs will be available. This applies to both cameras and window captures (as long as the window is present when the app starts).
Step 5: Configure Real-time Analysis
Once your camera is available in the application, a final, optional, configuration step can be done.
Configure Analysis Settings
- Click the "Engine" tab in the top menu bar
- Adjust analysis trigger parameters
- Open the analysis setup dialog

-
Set Analysis Frame Rate
- Use the frame rate slider (25ms - 2000ms intervals)
- Recommended: 250ms (4 FPS analysis) for balanced performance
- Lower values = more frequent analysis but higher CPU/GPU usage
-
Configure Accuracy Settings
- Default: 70% accuracy threshold
- Higher values = more accurate analysis but slower processing
Start Camera Feed
- Toggle camera on using the Activity controls in the cameras menu bar
- Verify your camera shows a live video feed with a green border (active state)
Step 6: Start Real-time Analysis
-
Return to the Cameras tab
-
Click the "Analysis" button (animated icon in the cameras menu bar)
- This enables the pattern-based analysis pipeline
- Button is only active when cameras are running
-
Wait for analysis to start
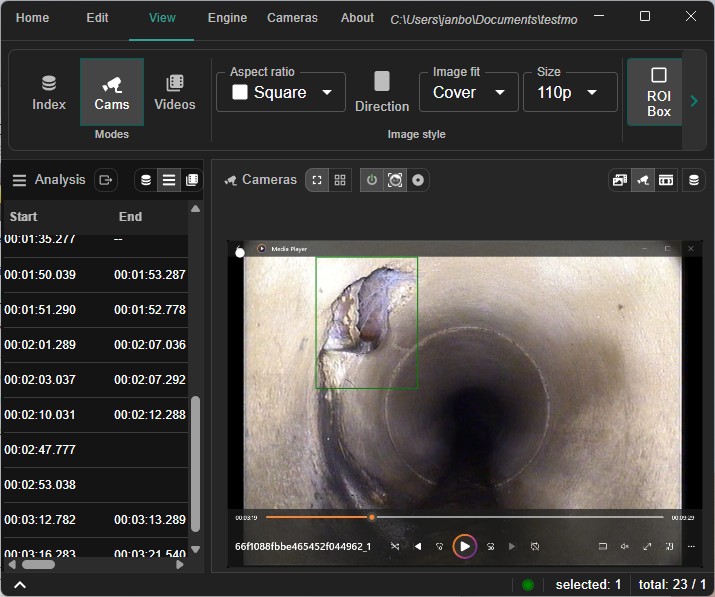
- You'll see analysis overlays appear on your camera feed
- Detected objects/features show as colored bounding boxes
- Analysis results appear as visual indicators and annotations

Step 7: Understanding Analysis Results
Visual Indicators
- Green border: Camera active and analyzing normally
- Red border: Alert condition or analysis issue
- Yellow border: Warning state
- Bounding boxes: Rectangles around detected objects/features
- Keypoints: Dots and/or a mesh marking important features (varies by analysis type)
- Green: all ok
- Gray: not certain enough to make a decision
- Red: there is a problem detected
Camera Status
- Loading: Spinner indicator during initialization
- Active: Green border with live analysis
- Error: Red border if camera connection fails
Step 8: Optional Advanced Configuration
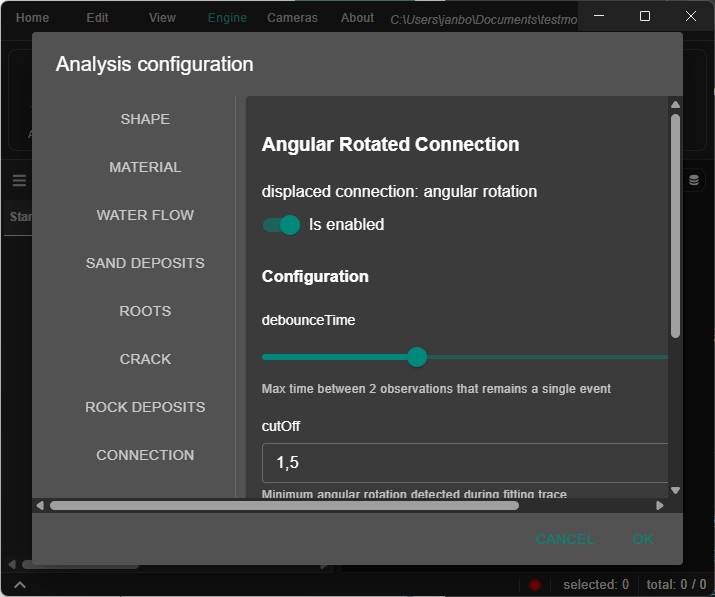
Enable Specific Analysis Types
- Click "Show Triggers" to open the analysis configuration
- Enable desired analysis types
- Provide individual configuration parameters for each trigger. This usually includes
- Debounce time: the nr of milliseconds to wait for a new observation before an event is closed.
Performance Optimization
- Adjust worker allocation in Engine settings for CPU/GPU usage
- Monitor system resources and adjust frame rates accordingly
- Use GPU processing when available for better performance
Step 9: Edit or Remove Cameras
To adjust or delete cameras:
- Open the camera menu by hovering over a camera tile and clicking the three dots.
- Choose
Editto rename the camera or change its settings. Updates appear in the preview instantly. - Choose
Removeto delete the feed from the grid when it is no longer needed.- Confirm the action to avoid accidental removal.
- Removing a camera does not delete any previously recorded files.
Troubleshooting
Camera not detected
- Check camera is properly connected
- Ensure camera isn't being used by another application
- Restart Vidsy.ai and try again
No analysis results
- Verify target objects/features are clearly visible and well-lit
- Check accuracy settings aren't too high
- Ensure analysis is enabled (Analysis button active)
- Check that ROI boxes and keypoints are shown from the 'edit' tab menu
Performance issues
- Reduce analysis frame rate (higher ms values)
- A good GPU can seriously increase performance.
Key Takeaways
- Camera setup is straightforward with live preview
- Use descriptive camera names to keep multiple feeds organized
- Real-time analysis requires both camera activation and analysis enablement
- Performance can be optimized through frame rate and resolution settings
- Analysis results are displayed with visual overlays, status indicators and an event list
- Cameras can be renamed or removed at any time via the camera tile menu
Your camera is now ready for live AI-powered analysis!